Dow Theory is often mentioned but mostly irresponsibly misused, explains JC Parets from AllStarCharts.com.I mean, the essence of Dow Theory is far richer than what you hear on TV or read online. Usually, when people talk about Dow Theory, they only focus on whether the Dow Jones Industrial Average and the Dow Jones Transportation Average confirm each other’s trends.This is indeed part of Dow Theory, but in my opinion, it doesn’t even rank among the top five most important principles. There are other aspects we need to pay more attention to.
Stock Market Averages
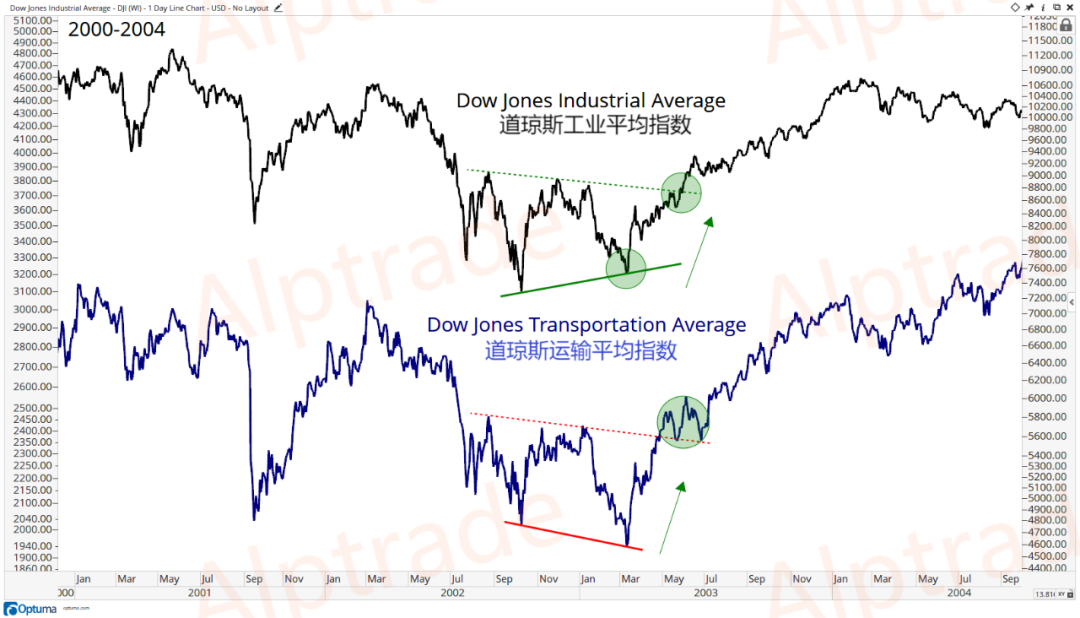
The concept of stock market indices originated from Charles Dow. He created the Dow Jones Industrial Average (representing companies that produce goods) and the Dow Jones Railroad Average (representing companies that transport goods). Today, the Dow Jones Railroad Average has been renamed the Dow Jones Transportation Average. These two indices remain crucial tools for assessing the overall health of the stock market.In an uptrend, if one index sets a new closing high, the other should also reach a new high or follow suit within a relatively short period (a few days or weeks). If this doesn’t happen—if one index makes a new high while the other diverges—it raises a warning flag for the ongoing trend.The same applies to downtrends. In a downtrend, if one Dow index hits a new low, the other should soon confirm with a new low. If not, it signals a potential trend change. Once prices start making higher highs and the other index follows with new highs, we get confirmation of a trend reversal.For example: In March 2003, the Dow Jones Transportation Average made a lower low, while the Dow Jones Industrial Average formed a higher low. This bullish divergence indicated a trend change—not a reversal, but a shift. When both indices broke out of their consolidation ranges in May of the same year, it signaled a shift to an uptrend:
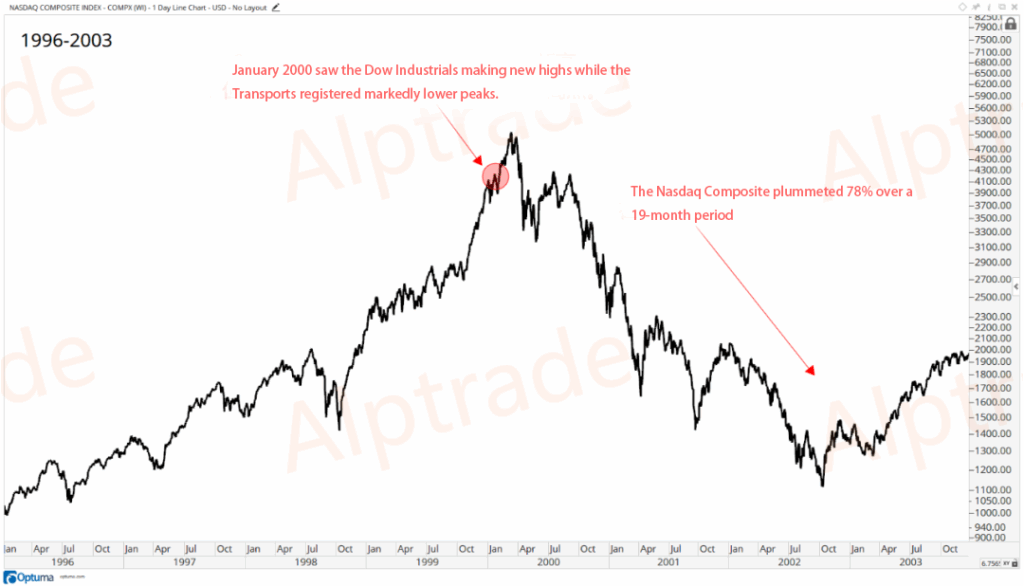
Rewinding a few years earlier, we can see what happened in early 2000. Just before the historic market crash, the Dow Jones Industrial Average hit a new high in the first weeks of the new millennium, but the Transportation Average had already fallen more than 16% from its recent peak. This wasn’t just a minor divergence—it was a massive signal:
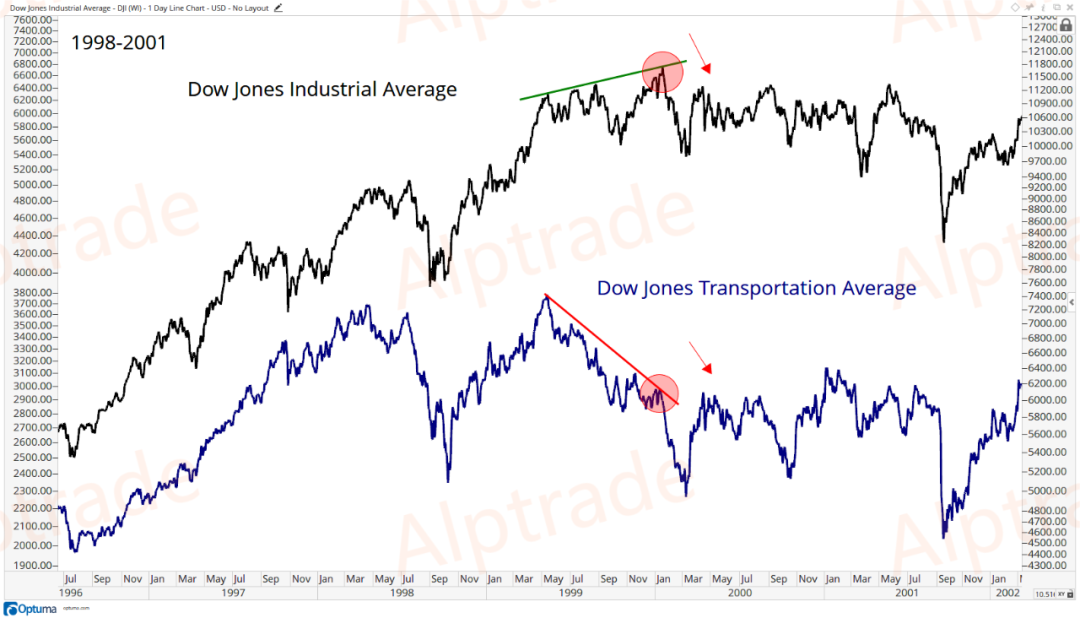
On January 14, 2000, the Dow Jones Industrial Average reached an all-time high, while the Transportation Average was already deep in a bear market. This divergence occurred nearly two months before the Nasdaq’s historic peak. This time, Dow Theory flashed a red warning signal in advance. In the subsequent crash, the Nasdaq Composite plummeted by 78%.
Remember, these are not buy or sell signals but tools to help identify trend direction. Also, the Dow Jones Utility Average is not part of Dow Theory because it didn’t exist when Charles Dow wrote his Wall Street Journal editorials. Still, we monitor it regularly, and it’s included in the Dow Jones Composite Average, which we rely on heavily.Dow Theory has many principles, and I’ve studied Charles Dow’s work for years. Every morning, while brewing coffee, I read two or three of his editorials from 1899–1901. It takes just a few minutes. What’s astonishing is that while the world has changed dramatically, the supply-demand dynamics driven by human fear and greed remain the same. As market participants, being a historian is crucial. If we don’t learn from history, we repeat the same mistakes—that’s an ironclad truth.
The Five Most Useful Principles
Here are the five principles I find most useful:
1. Trend Identification
This is often overlooked, and I don’t know why. Whether we’re looking at stocks, indices, or commodities, the first thing to do is identify the primary trend. Are we in an uptrend, downtrend, or no trend at all? This might sound overly simple, but it’s the first step we must take when analyzing any asset.
Using multiple timeframes helps identify trends. First, you need a long-term primary trend, which can be identified using weekly or monthly charts. Within this major trend, there are secondary trends observable over intermediate timeframes (weeks or months). Finally, these secondary trends consist of smaller trends lasting hours to days. The smallest trends contain the most noise—and this is what financial media loves to focus on. They probably think covering short-term noise attracts more viewers.But in the real world, for most people who genuinely want to make money in the markets, this timeframe is the least relevant. The primary trend, which typically lasts over a year, is what matters most.
2. The Averages Discount Everything
The collective behavior of global investors determines price movements. All known information—whether fundamental, macroeconomic, or opinions from sellers, buyers, or retail investors—is already priced into the market. All knowledge, all foreseeable events, and any factors affecting supply and demand (including human fear and greed) are reflected in prices.This applies not just to indices but also to individual stocks and futures. Even unpredictable “acts of God,” like earthquakes, natural disasters, or terrorist attacks, are quickly assessed by the market and almost instantly reflected in price movements.
3. Closing Prices Matter Most
Dow Theory doesn’t care about intraday highs or lows or pre/post-market moves. These are just noise in the smallest trends. Those who profit from noise focus on these and invent reasons to explain why the market moved up or down in a few hours—even if they don’t actually know why.For most market participants who genuinely want to make money (excluding the 0.0000000001% of day traders), recognizing that closing prices matter most is critical. How often have we seen early sell-offs reverse to finish higher or early rallies fade to close lower? By the time the market closes (e.g., 4 PM ET for U.S. stocks), the global market has collectively settled on a final price—that’s what we should focus on.Personally, I often see investors overlook this. Many call or email me in the morning, but by 4 PM, the market has completely reversed. More commonly, early-week declines turn into mid-week rebounds. Friday’s close is especially important. Month-end closes are also valuable for maintaining a long-term perspective.
4. Trends Persist Until They Don’t
Markets move in trends. While short-term countertrend moves happen, prices are more likely to continue in the direction of the primary trend. This is, of course, a favorite principle of trend traders.A trend isn’t complicated: An uptrend is a series of higher highs and higher lows; a downtrend is lower lows and lower highs.With modern advancements, we can use smoothing tools (like moving averages), momentum indicators (like RSI), and trendlines to aid analysis. Trend identification is somewhat subjective and experience-based, varying by investor personality, risk tolerance, and timeframe. But the key takeaway is: Probability favors trend continuation, not reversal.
5. Bull and Bear Markets
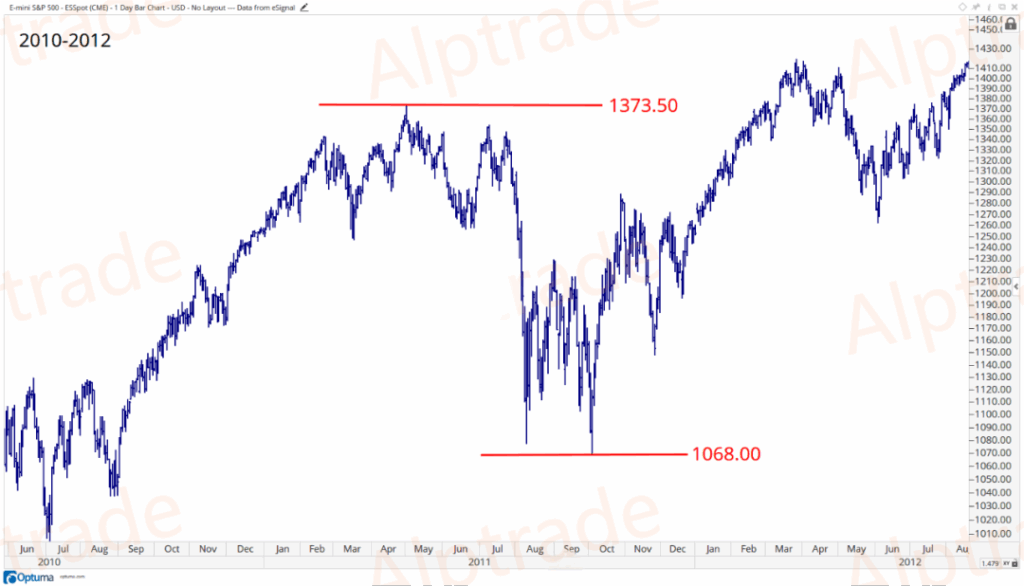
You’ll sometimes hear people say: “A 20% move defines bull and bear markets.” In other words, if the market falls 20% from a high, it’s in a “bear market”; if it rises 20% from a low, it’s a “bull market.”This is an outright lie, usually peddled by media outlets that make money from ads, not from participating in markets.Remember: 20% is an arbitrary number. Imagine how absurd this logic is: If the market drops 19.9%, it’s still a bull market, but at 20.0%, it suddenly becomes a bear market? Really?You’ll also hear: A 10% drop is a “correction,” and 20% is a “bear market.” This is equally nonsensical. 10% and 20% are both arbitrary thresholds.At some point, people started defining “bull” and “bear” markets (and “corrections”) with specific percentages. It’s utterly ridiculous.Especially in today’s headline-driven financial news, you’ll increasingly see titles like “Stocks Enter Bull Market Territory” or “Market Teeters on Bear Market Edge.”Hint: There’s no material difference between a 19% and a 21% market rise. Don’t let these terms fool you into changing your behavior. No one rings a bell to announce the start of a bull or bear market—and it certainly doesn’t “officially” begin at some arbitrary percentage.—Tom BrakkeI prefer the 18-month rule for observing major indices. If the market hits an 18-month low, the time factor suggests it’s completing a full cycle. For example, in 2011, S&P 500 futures fell over 22% in just five months. Was that a bear market? I think labeling it as such is meaningless because it lacked the “time” element—it wasn’t a complete cycle.
The 2015–2016 case is more fitting. Here, the time factor was evident. Many stocks peaked in Q4 2014 (including the Dow Jones Transportation Average), and by early 2016, over 70% of Russell 3000 stocks were down more than 20% from their 52-week highs. This “broad participation” is what we use to define trends:
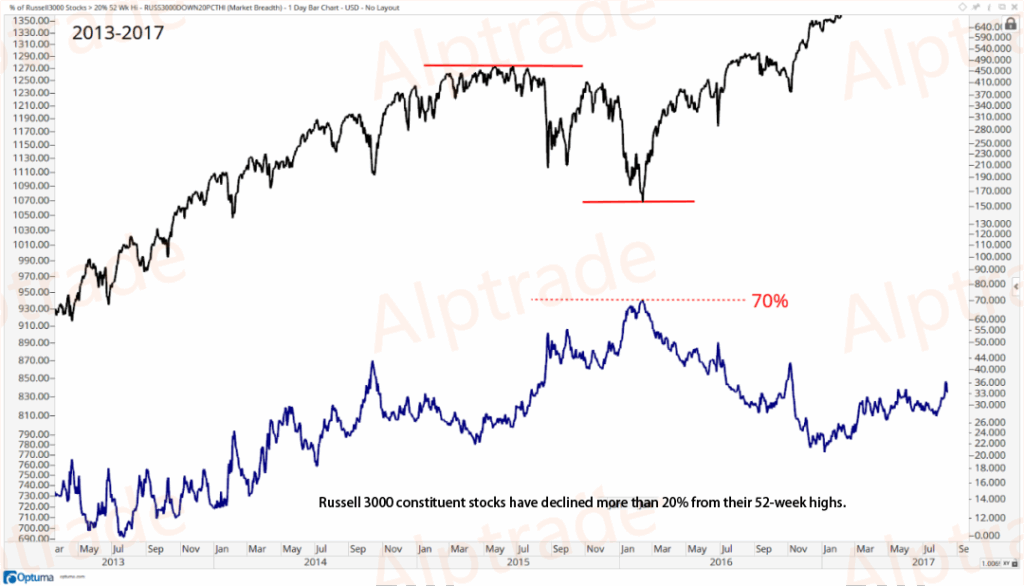
What we want to see is: Is the market making lower lows and lower highs, with more stocks joining the decline? This must persist over time, not just for a few months.Conversely, in an uptrend, we look for higher highs and higher lows, with more stocks participating. We need a combination of time and market breadth—not an arbitrary 10% or 20% number. When you hear someone defining markets this way, don’t just walk away—run.
How Charles Dow Defined Market Cycles
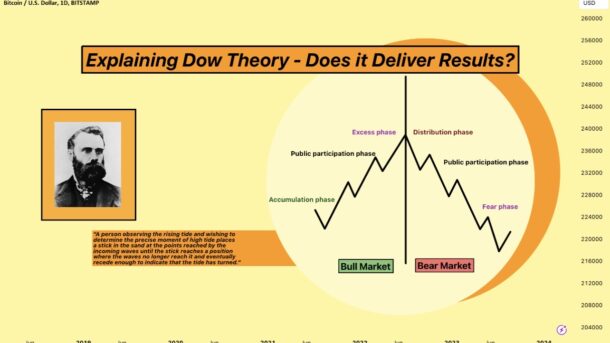
Bull Market
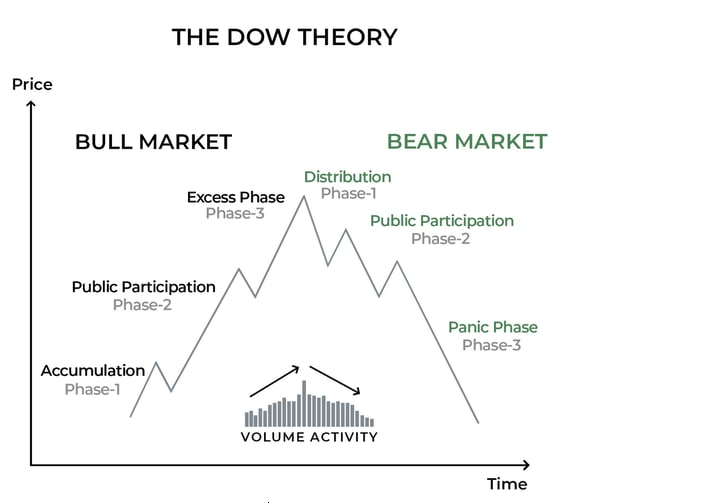
A primary uptrend or bull market typically (but not always) has three phases:
- Accumulation Phase—The first phase is accumulation, where a stock has been heavily beaten down. Market sentiment is usually extremely pessimistic. Financial media rarely have positive coverage, and news is mostly about how the company is struggling.
- Advancing Phase—The second phase involves steady price increases. Technical traders looking for “breakouts” start participating. Skeptical media and the public often dismiss this as “short covering,” a “junk rally,” or whatever absurd explanation they concoct at the time.
- Exuberance Phase—The final phase is the most exciting, with endless good news and peak public participation. Stocks—regardless of fundamentals—get bid up wildly. Media may even create nicknames or new “sector themes” for them. Wall Street analysts keep raising price targets, sometimes competing to see who can name the highest number. It’s at this stage that your college friend might call asking, “Should I buy now?”—when they should really be asking, “Should I sell now?”
Bear Market
Similarly, a primary downtrend or bear market can also be divided into three phases—though, like bull markets, no two are identical. As the old saying goes: “It’s not that this time is different; it’s that every time is different.”
- Distribution Phase—The first phase of a bear market is often distribution. Here, media and retail investors remain enthusiastic, but institutional money starts worrying about overvaluation and begins selling. This is a process—like turning a massive ship—that takes time. If you pay attention, you can spot it. Meanwhile, media and retail still believe “buying the dip” will work, as it has for years. But in this phase, rallies get sold into, and breakouts fail.
- Panic Phase—The second phase involves panic. After months of sideways action (distribution), the market breaks down instead of up. Sometimes, this panic turns into a vertical crash. Media will ask, “What went wrong?”—fueling more fear. “Market turmoil special reports” start airing (always too late, never before the decline begins).
- Capitulation Phase—By this point, prices are far from highs. You’ll see increasing numbers of investors giving up—either on individual stocks or the entire market. News is worse than ever, and public sentiment hits extreme negativity. But it’s in this environment that the bear market’s third phase emerges—and the next bull market is often born. We look for signs of accumulation, bullish divergences, and improving market internals. The next bull market’s leaders often emerge here—stocks that don’t make new lows with the broader market tend to become future leaders. This relative strength appears early and is worth watching.
Charles Dow
Charles Dow first published his “Dow Theory” in the late 19th century, and it remains relevant today.Technology has advanced, and markets have evolved, but the only constant is human nature.Our fear, greed, and psychological makeup never change—and that’s the fundamental force driving price movements: ourselves.The most widely known (and noisiest) aspect of Dow Theory is the idea that the Dow Jones Industrial Average must confirm the Dow Jones Transportation Average’s trend.This is undoubtedly important but should only be applied over longer cycles. Contrary to popular belief, it’s not a buy/sell signal. I often see people interpret trend confirmation as timing advice, but it’s not—which is why it doesn’t even make my top five Dow Theory principles.You might also notice I didn’t include volume in my top five. This is intentional. To some circles, this might be “heresy,” but I’m fine with that. Charles Dow’s argument that “volume confirms price” isn’t as useful today. In the 19th century, there were no derivatives or dark pools. So while I respect the technical analysis pioneers who treated volume as almost equal to price, I firmly disagree. The times have changed, so I don’t even put volume on my charts. I only check if liquidity is sufficient for me to participate—volume as a confirmation tool isn’t my concern.That’s my take on Dow Theory. I hope this helps you understand how I use a 130-year-old theory to interpret markets—because it still works today!